When FIFA president Gianni Infantino recently announced that there had been 500 million ticket requests for the 2026 World Cup, the number was designed to sound unbelievable. But it also raised a simple question: what does that actually mean in the context of previous tournaments? Loud headlines are one thing, filling stadiums for every match is another. This prompted SportingPedia to look back at every World Cup from 1930 to 2022, and to rank tournaments by average attendance per game – the fairest way to compare editions with different formats and numbers of matches. The data shows which hosts truly packed their stadiums, which tournaments benefited from giant arenas and football booms, and how high the bar is for the expanded 104-match World Cup in 2026.
The data shows a clear picture: the United States in 1994 remains the all-time benchmark, with an average match crowd of 68,626 and a total attendance of 3,568,567. Brazil 1950 ranks second by average despite its smaller format, while Brazil 2014, Qatar 2022 and Germany 2006 complete a modern top five dominated by large, football-mad hosts. For 2026 to shatter all attendance records, it will have to match or exceed the kind of stadium filling that only a handful of tournaments have ever achieved.
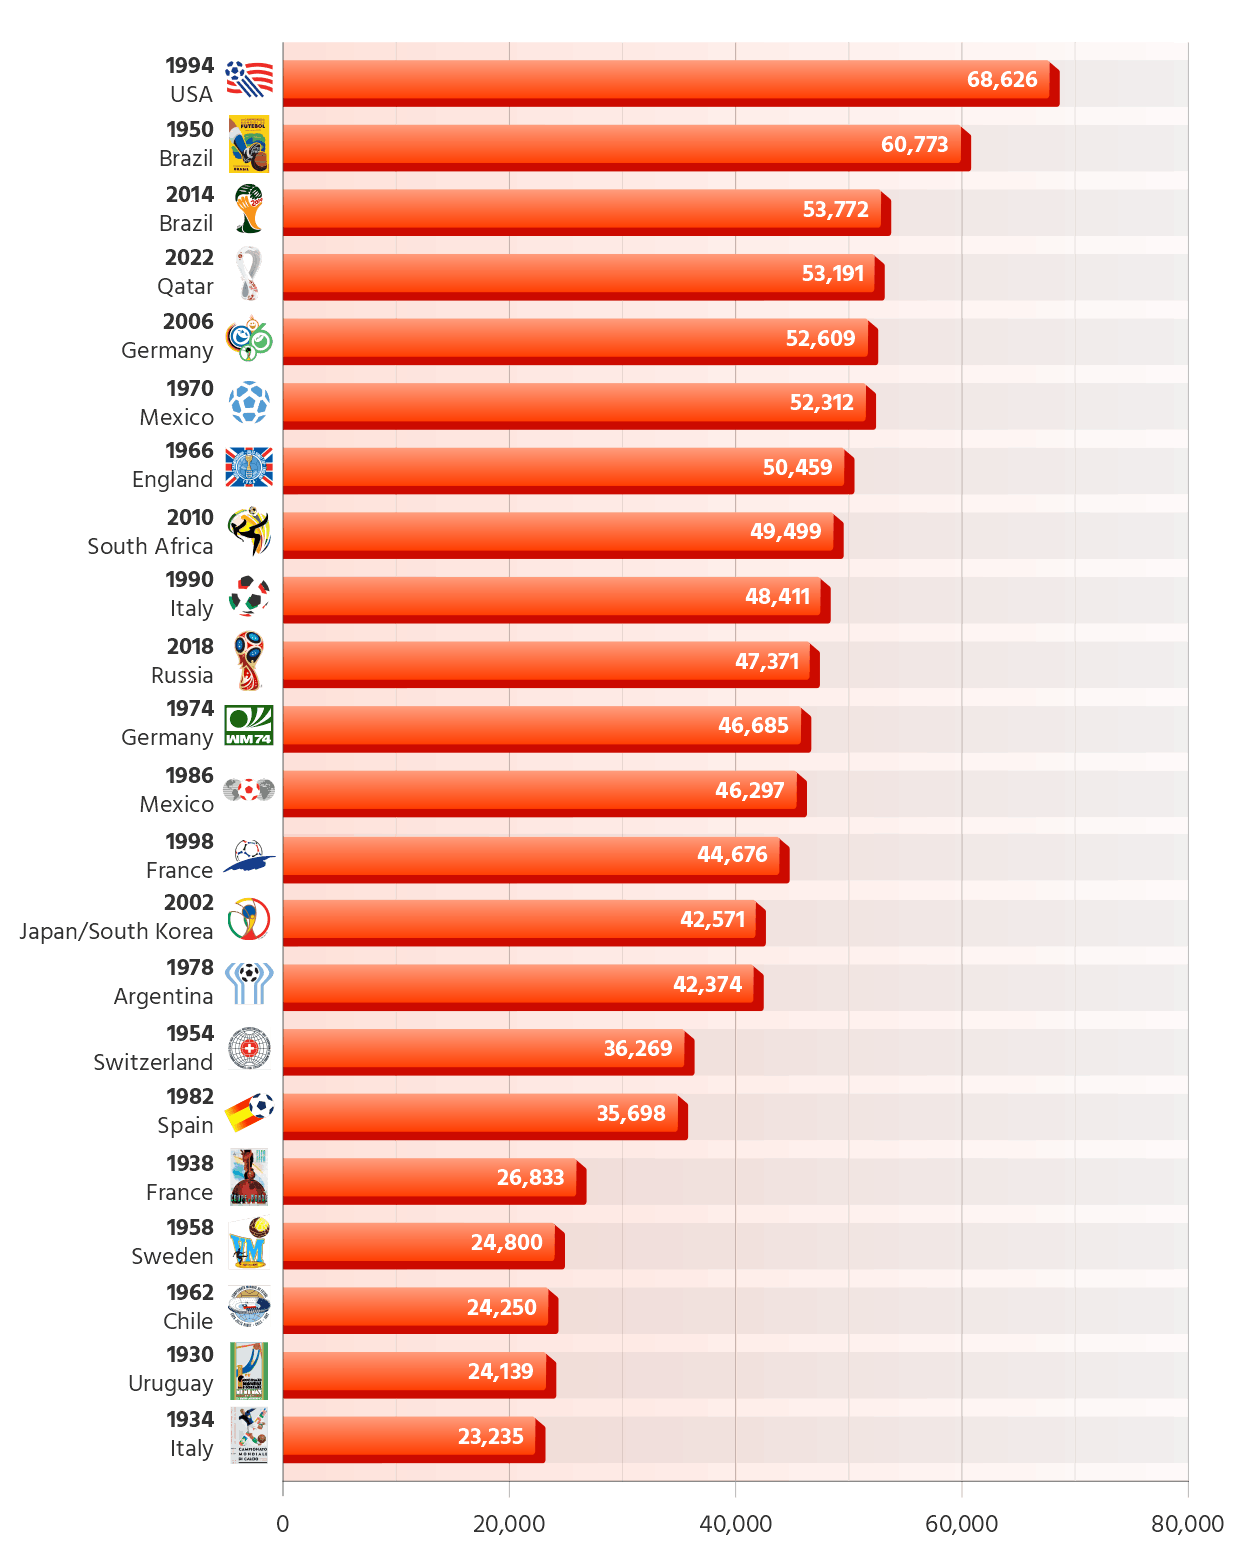
Fifa World Cup Editions Ranked by Average Attendance
Data Source: Fifa.com
USA 1994: The benchmark that still stands
The 1994 World Cup in the United States remains the gold standard for crowds. With a total attendance of 3,568,567 and an average of 68,626 per match, it tops the ranking by a comfortable margin. Even though the tournament was smaller than today’s editions in terms of number of teams, the use of huge American stadiums and strong interest across multiple host cities produced record numbers that have yet to be surpassed.
The legacy of 1994 is visible in almost every comparison. No other tournament has come close to its average crowd figure, and only four later editions – Brazil 2014, Qatar 2022, Germany 2006 and South Africa 2010 – have matched or exceeded its total attendance. Any talk of 2026 “breaking all records” invariably circles back to the benchmark set more than three decades ago.
Second in the ranking by average attendance is Brazil 1950. With a total of 1,337,000 spectators and an average of 60,773 per match, it stands out among early World Cups as a clear outlier, helped significantly by vast attendances at the Maracana. The overall number of games was much smaller than in modern tournaments, which is why the total attendance is lower than later editions despite such a high average.
Brazil’s second time as host, in 2014, also ranks near the top. That tournament drew 3,441,450 spectators in total, with an average of 53,772 per match, placing it third in the historical ranking. Between the two Brazilian editions, separated by 64 years, you can trace the shift from a single iconic stadium to a nationwide network of modern arenas – but in both cases, crowds were among the most impressive the competition has ever seen.
Qatar 2022 sits fourth by average attendance with 53,191 spectators per match and a total crowd of 3,404,252. Despite being hosted in a compact country with a limited number of venues, the combination of high demand, concentrated scheduling and new stadiums pushed both average and total attendances into the upper tier of World Cup history.
Germany 2006 is close behind in fifth place, with 3,367,000 fans and an average crowd of 52,609. Mexico 1970 (52,312) and England 1966 (50,459) complete the group of tournaments that have averaged more than 50,000 spectators per match. Taken together, these editions highlight how consistently the World Cup has filled large stadiums whenever it has been hosted in countries with strong football culture and appropriate infrastructure.
From Italy 1990 onwards, every World Cup has recorded an average attendance above 42,000, underlining how far the tournament has come from its early years. Italy 1990 drew 2,527,348 fans with an average of 48,411, while South Africa 2010 reached 3,167,984 spectators and a 49,499 average – remarkable figures for the first World Cup played on African soil.
France 1998 (2,859,234; 44,676), Japan/South Korea 2002 (42,571) and Russia 2018 (47,371) all sit comfortably in the upper half of the historical table. Mexico’s second World Cup in 1986 (46,297) and Germany’s first tournament in 1974 (46,685) show that high attendances in well-developed football countries are not a purely recent phenomenon, even if stadium capacities and tournament formats have changed over time.
At the lower end of the ranking by average crowd are the early World Cups. Switzerland 1954 (36,269) and Spain 1982 (35,698) sit in the mid-table, but once you move back to 1938 and earlier, the numbers drop sharply. France 1938 drew 483,000 fans with an average of 26,833, while Sweden 1958 (24,800), Chile 1962 (24,250), Uruguay 1930 (24,139) and Italy 1934 (23,235) all recorded averages in the mid-20,000s.
These figures reflect a different era: smaller stadiums, fewer matches, lower global visibility and less developed travel infrastructure. Comparing them directly with modern editions shows just how far the competition has grown as a global event, both on television and at the turnstiles.
What 2026 has to beat
Looking ahead, the expanded 2026 World Cup in the United States, Canada and Mexico will feature 48 teams and 104 matches in some of the largest stadiums in world sport. On paper, the combination of huge venues, improved transport links, and far better logistics than in 1994 – from airport capacity and internal flights to high quality roads, public transit and digital ticketing – gives this edition a clear route to breaking the total attendance record set in the United States three decades ago. For many fans, simply getting to and around host cities has never been easier.
There are, however, factors that could pull in the opposite direction. Ticket prices have already raised questions about how accessible the tournament will be for local supporters and travelling fans, especially once the cost of long haul flights and accommodation is added. The wider political climate in the United States may also influence international demand. The legacy of Donald Trump’s foreign policy and rhetoric, and any renewed debate around visas and entry conditions in the build-up to 2026, could discourage some fans from certain regions even if they are keen to attend.
To surpass 1994 on average attendance, 2026 would need to exceed 68,626 spectators per match across all 104 games, not just the marquee fixtures. The historical numbers show that only a handful of tournaments have even cleared 53,000. Whether modern infrastructure and global interest can outweigh pricing concerns and political headwinds will ultimately decide where 2026 sits in the all-time World Cup attendance table.
Fifa World Cup Group Stage Matches Category 2 Ticket Prices
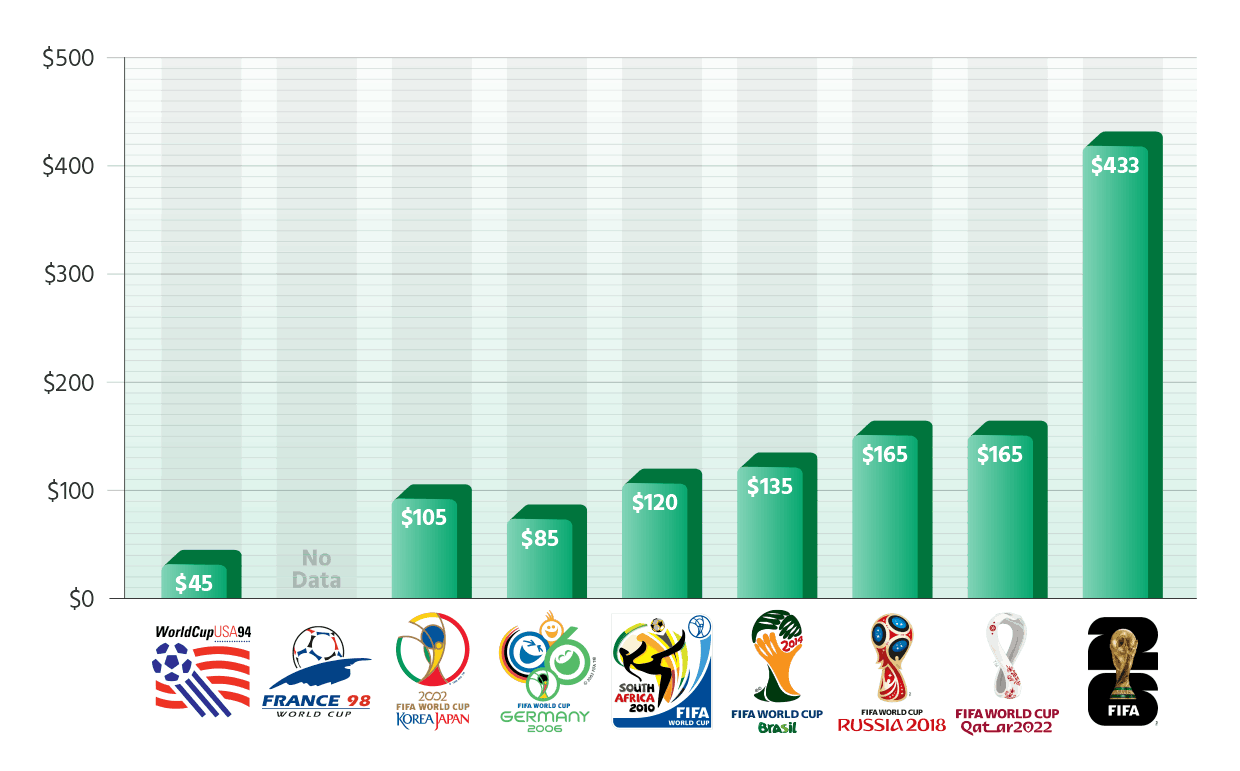
Data Source: theworldcupguide.com
Ticket Prices Surge
One of the biggest differences between 1994 and 2026 is not the number of matches, but what it costs to get through the turnstiles. Looking at Category 2 tickets for group stage games, prices have climbed from just $45 at USA 1994 to a projected $433 for 2026 – an increase of more than 860%, or almost ten times the original figure.
After 1994, prices jumped to $105 for Japan/South Korea 2002 and then eased slightly to $85 at Germany 2006, before entering a steady upward curve: $120 in South Africa 2010, $135 in Brazil 2014 and $165 in both Russia 2018 and Qatar 2022. The leap to $433 for the 2026 World Cup therefore represents a break with recent tournaments: more than four times the 2002 price, around 220% higher than Brazil 2014, and over 160% above Russia and Qatar despite using the same $165 Category 2 baseline.
Set against record demand figures and vastly improved transport and logistics in North America compared to 1994, this ticket ladder raises a central question for 2026: even if FIFA can sell out the biggest matches, will such steep prices make it harder to keep attendances close to capacity across all 104 games, especially in lower-profile fixtures and in cities where local demand is more price sensitive?